|
Getech PLC (GTC:LON) is a tiny little firm floating on the AIM market of the LSE. It currently languishes just above it's all time low and market sentiment toward the company is unequivocally bearish. Sounds like my kind of company. GTC operates in the O&G Equipment and Services Industry, not a great business to be in right now! Here's a quick description of the company's history and operations; "Getech Group plc is a leading consultancy providing geological and geophysical services to the oil, gas and mining industry. The client base comprises all the major and many smaller oil companies, as well as a number of major mining companies. The Company is based in Leeds, England, where it has more than 90 staff. It also has a subsidiary in Houston, Texas which operates primarily as a marketing entity. The Company originated as a spin-out from the University of Leeds, and since it started trading in 1986 has acquired the largest commercially available library of global gravity and magnetic data. In September 2005 the Company floated on the UK AIM stock market. In 2004 it established the Petroleum Systems Group. Since then it has built a multidisciplinary geoscience team which includes: geophysics, structural and tectonic analysis, geochemistry, palaeogeographic mapping, petroleum geology and palaeoclimatology. The Company maintains its technical quality and reputation through the quality and reputations of its staff and continuing innovation." Here's a few numbers; Market Cap = £4.14 Mil Share price = 11.5p Common = 37.6 Mil 52 week high/low = 32.2-10.5p Adj. BV = £8.98 Mil (£12.38 Mil - Goodwill of 3.4 Mil) Cash = £2.99 Mil Total Liabilities = £4.3 Mil Here's BV for the previous 3 years; FY2018 = £12.74 Mil FY2017 = £12.17 FY2016 = £12.16 And here's Rev's and Net Profits/Losses for the same time period; FY2018 = £8 Mil/£544k FY2017 = £7.2/£65K FY 2016 = £7/£1 Mil Given the destruction we've seen in the energy industry I won't be surprised if sales and earnings get obliterated in the next year or two. I'm not interested in the next year or two though, I'm looking four or five years down the line. Now to the charts. 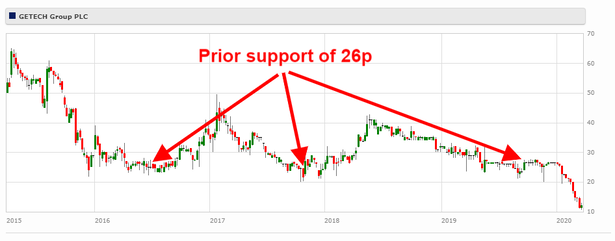 GTC 5 Yr Chart GTC is down 76% on the five year chart. Previous support was around 26p which you can see throughout 2016, late 2017 and most of 2019. Then comes the sell off. 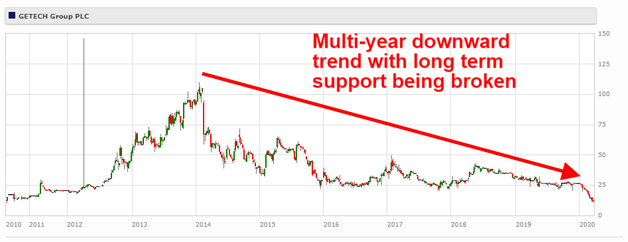 GTC 10 Yr Chart The ten year chart starts to give us a bit more perspective. GTC has been on a downward trend for some time now, in the past it's sold several hundred percent higher than it does today. Even now it's still down 16% on where it was ten years ago, the market currently hates this stock and yet I am drawn to it. 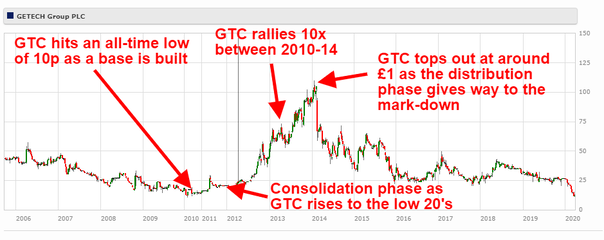 GTC Long-range Chart And now to the long range chart, stretching all the way back to Oct 2005. GTC hit its all-time low of 10p back in April 2010 after building a base in 2009. As it moved into 2011 it passed into the consolidation phase rising to the low 20's. Then, in 2012, it moved into the mark-up phase as the rally began which saw the stock top out at around £1 in early 2014, a 10-bagger in under 4 years. Since then the story hasn't been good, aside from the occasional short term rally it's been a continuous downward trend which has brought us right back to where we are now, hovering above the all-time low. This is when I like to buy, when everyone one else is running for the exit and off-loading their stock at any price they can get. Now back to some numbers. At this point I should probably let you know that as well as the £3.4 Mil of Goodwill on the balance sheet there's also around £4.26 Mil of intangible assets , this is data sets and other such ephemeral stuff that Ben Graham would apportion a big fat 0 in value to. Let's scrub that off the BV too. That leaves us with a BV of £4.72 Mil, around £600k above the current market cap. Not much of a discount now but I'm picturing where this stock could be in five years, not six months. Total liabilities are £4.3 Mil but we've got the cash of £2.99 Mil and receivables of 2.4 Mil. We've also got some property to boot too.  GTC HQ GTC bought this pretty little thing back in 2006 for around £2.5 Mil and it is currently being carried on the books at £2.4 Mil. The property is presently on the market and has been since 2018. Whilst management has noted some interest they've yet to receive any offers. This isn't surprising given all the uncertainty Brexit created and we are unlikely to see a sale any time soon either. Nevertheless, it's another hard asset on the books.
Share dilution is to be expected here, back in 2009 the common stood at 29 Mil and now it sits at 37.6 Mil. An approved share option scheme is in place for around 2.5 Mil shares with expiration dates ranging from 2020-2028. On top of that there's an unapproved options scheme which could see another 1.7 Mil shares added. Earnings are lumpy with GTC, some years it earns £1 or £2 Mil and in others it bleeds red. There's no doubt that the current destruction in the O&G industry is a bad sign for the firm. A few years of hard times are ahead. Much like all the other moribund stocks that find a home in my portfolio, I'm betting that some will scrape through and make up for the ones that don't. GTC is just another of these tiny hated stocks that catch my eye. My buy decisions are painfully simple these days, my primary focus is on the balance sheet and long range price charts . If the stars align in a manner I see fit I buy without thinking about future earnings too much. I'm asking myself a few basic questions; "Where has this company been and where might it be in a few years time if the situation improves?" and "Does it have the financial resilience to struggle through until the good times return?" For those of you that want a more thorough analysis of GTC which drills down into the accounts I recommend UK Value Investor Maynard Payton's excellent post here. There are many risks here for sure, maybe management decides to take the firm private to save costs or another firm swoops in to buy it up on the cheap. Maybe the downturn in the energy industry is a painful drawn out affair and GTC ends up on the scrapheap of business history like most other tiny firms do. Then again, maybe they manage to navigate a path through the carnage, maybe they end up selling the property and shoring up the balance sheet. Maybe when all this doom in the O&G industry passes the orders start to come in and GTC becomes another 10-bagger. Maybe, just maybe... David Long GTC:LON
12 Comments
mike
4/1/2020 09:06:30 pm
This interesting stock is likely to change strongly in line with the oil price. Alternatives would be, for example, a fund like PSCE.
David
4/2/2020 12:51:33 am
Yeah, there's a good chance this might drop a little more but not by much. I'm probably a bit early with this buy, you could just wait for the accumulation phase to move into the consolidation phase and still capture a multi-bagger, assuming no black swan event derails the thesis.
Alex
4/3/2020 01:10:20 pm
Loved the analysis! I'll definitely apply some of the points you searched for to my own company research. A couple questions.
David
4/3/2020 02:45:18 pm
Hi Alex,
Mike
4/3/2020 05:53:25 pm
It is not possible to buy this stock via interactive brokers (and maybe also via other big brokers?). As this is the largest broker worldwide, this could be detrimental/negative to the price development e.g. compared to an OTC U.S. oil stock.
David
4/5/2020 01:54:00 pm
GTC is a tiny illiquid little firm, it doesn't take much volume to move these types of stocks up and down. There's enough coverage of this from European and UK domestic brokers to facilitate sufficient trading. The more illiquid and thinly traded a stock is the more I like it. It is harder to accumulate but prompts larger upward share price movements and supply/demand imbalance when positive news emerges.
Mike
5/2/2020 07:31:18 pm
I am wondering if you could just apply the strategy from Walter Schloss related to the price chart instead of some more complex charting analysis. Schloss liked to buy stocks which were traded at a multi-year low, which is very simple.
David
5/2/2020 08:48:15 pm
Hi mike,
Mike
5/2/2020 09:08:37 pm
What would you think about a price that has only gone down without any clear support level; an example would be Dolphin Capital Investors (DOLC). I dont know if based on such a chart this stock could be a buy or a stay away situation.
David
5/2/2020 09:59:33 pm
Generally I follow Ted's advice to look for stocks that have long-range price charts showing evidence of the four phases he outlines in his book;
Peter
5/19/2020 02:48:24 pm
Great idea! Maybe worth checking out exasol, a new IPO in the big data software space.
Joe
12/10/2020 01:32:31 pm
Hi David Leave a Reply. |
David J. FloodUK based Investor. I focus Archives
February 2023
Categories
All
BLOGS I FOLLOW
No Name Stocks Svenda's Manual of OTC Stocks Caveat Emptor Stocks Leaven Partners OTC Adventures Nothing But Net Nets Clark Street Value Value Investing Blog Alpha Vulture Deep Value Investments OddballStocks Value Stock Geek Barel Karsan - Value Investing Shadow Stock Hidden Value Yet Another Value Blog Streets Of Value TES Optimal Value Investing The Bad Investor Undervalued Japan Liquidation Almanac Adventures in Capitalism White Chip Stocks Light Blue Value Global Investing Insight Mesaba Range Value The Market Plunger Neto's Notes Battleship Investing Blog The Investment Long-List Oceania Value Grahamian Value Digest Stock Speaking Canadian Value Stocks Analyzing Bargain Stocks MicroValue Hidden Gem Investing |
 RSS Feed